Client Context
Working with contractors on large infrastructure projects in the UK and Australia, the client needed a better way to manage health, safety, environmental and security risks. Traditional spreadsheets weren’t cutting it – too slow, too siloed, too easy to miss things.
The Challenge
- Hazards were buried in spreadsheets – hard to see, harder to act on.
- Teams struggled to track ownership, progress and closure of risks.
- No single source of truth – data scattered across drawings, surveys, and reports.
- Risk conversations were reactive, not collaborative.
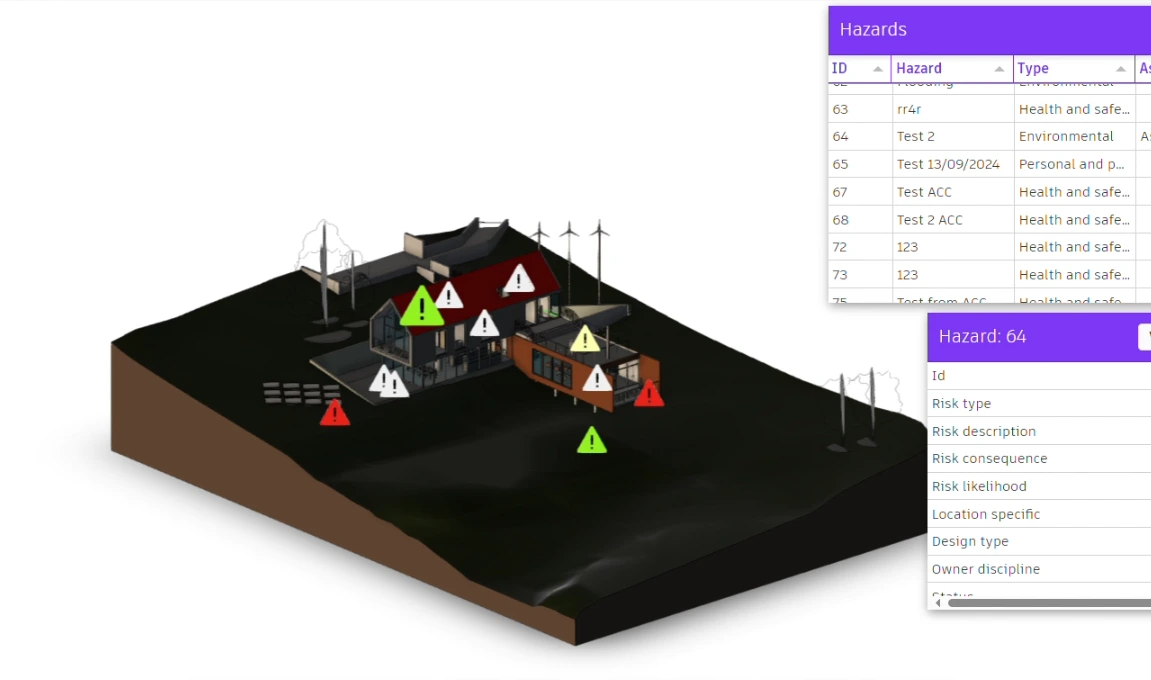
The Solution
I built an app that visualises an entire project in 3D, integrating GIS and BIM. Hazards can be geolocated, categorised, scored, filtered and overlaid on maps or 3D models. Data (photos, drawings, surveys, calculations) sits behind each hazard. A dashboard tracks KPIs, benchmarks performance, and provides a full audit trail.
The Impact
- Deployed on 10+ major infrastructure projects across the UK and Australia.
- Enabled structured capture of 2000+ hazards – with over half closed out and risk levels reduced.
- Shifted teams from Excel spreadsheets to a transparent, collaborative 3D/GIS environment.
- Improved compliance, traceability, and decision-making with a clear audit trail.
- Faster, more focused stakeholder conversations through risk layers and dashboards.
Call to Action
Want to move beyond spreadsheets and make risk management visual, collaborative and auditable? Let’s talk.
Leave a Reply